TLD Glow-Curve Deconvolution
Below are informations of glow-curve deconvolution program. The program can be found at Home Page.
Contact Info
Nguyen Phuong Dang
Glow Curve Analysis
The purpose of this program is to analyze complex TLD glow-curves with overlapping peaks. It was designed to use with the TLD detectors which are clinically used at Froedtert & Medical College of Wisconsin facilities.
The glow-curve deconvolution is based on the first-order kinetic with an approximation of the second order. In that condition, a single glow-peak intensity is given by the equation
\[ I(T) = I_m \mathrm{exp}\left[ 1 + \frac{E}{kT} \frac{T-T_m}{T_m} - \frac{T^2}{T_m^2} \mathrm{exp}\left( \frac{E}{kT} \frac{T-T_m}{T_m} \right) (1-\Delta) - \Delta_m \right] \]
where \( \Delta = \frac{2kT}{E}, \, \Delta_m = \frac{2kT_m}{E} \), \(I\) is the glow-peak intensity, \(E \) is the activation energy, \(T \) is the heating temperature, \( I_m \) is the maximum intensity, and \( T_m \) is the temerature at which \( I_m \) occurs. The current developed algorithm can deconvolute 4 glow-peaks from the TLD glow-curve. In addition, a background term\[ bkg(T) = a + b\,\mathrm{exp}(T/c) \]
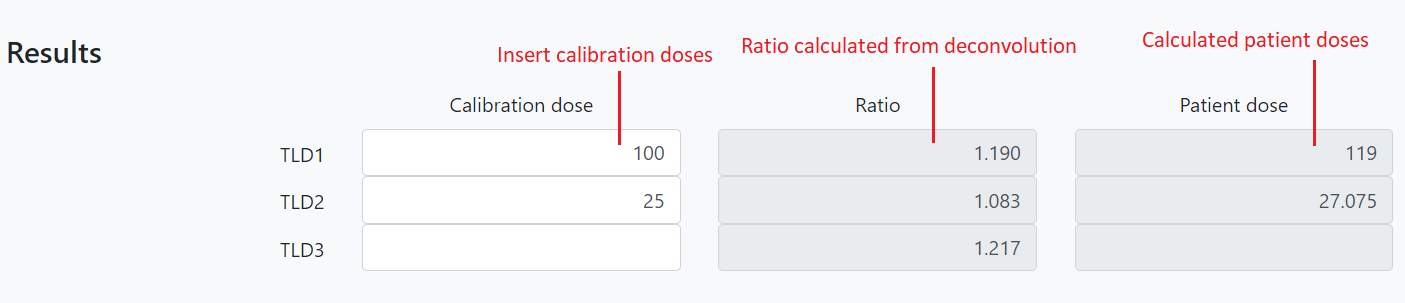
was also added to the deconvolution. The non-linear least-square minimization using Trust Region Reflective method was chosen to perform fitting process in this program.From deconvolution result, patient dose \( Dose_{Pat} \) is calculated as
\[ Dose_{Pat} = \left( \frac{PeakArea_{Pat}}{PeakArea_{Cal}} \right) Dose_{Cal} \]
where \( PeakArea \) is the area of peaks 3 and 4 from the deconvolution, and \( Dose_{Cal} \) is the known dose exposed to TLD in the calibration step.How to Use
- Run the program, select input patient and calibration data files (in ASCII format) from the file-select boxes, and then hit the "Load data" button.
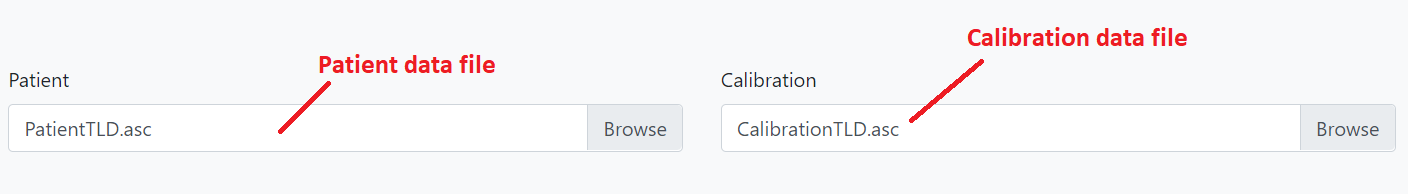
- A confirmation dialog will appear, check all patient and calibration TLD labels matched and click "Confirm". If not, click on the table cells and edit labels.
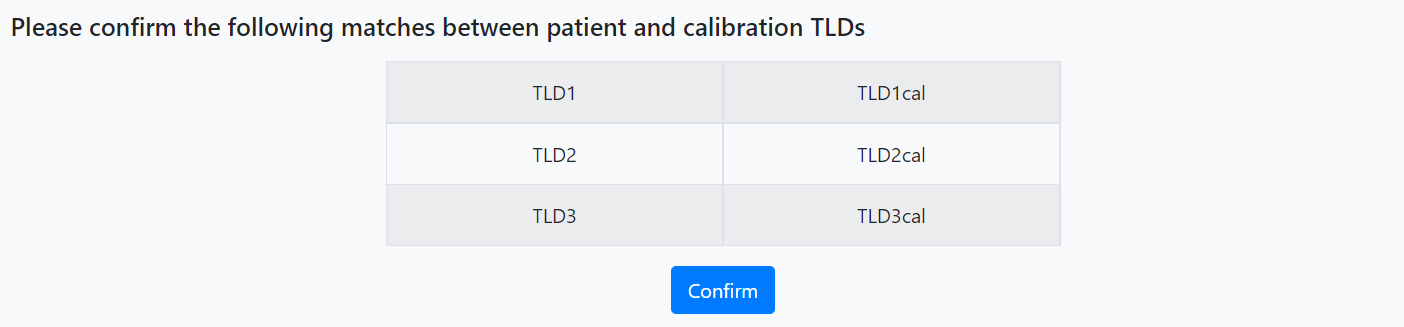
- When the dialog "Thank you for your confirmation. Let's start the deconvolution..." appears, press "Start".

- It takes 3-5 minutes to read and analyze input data. After finishing, the "Results" section will shown up, user inputs calibration doses to calculate the doses received by TLDs during patient treatment.
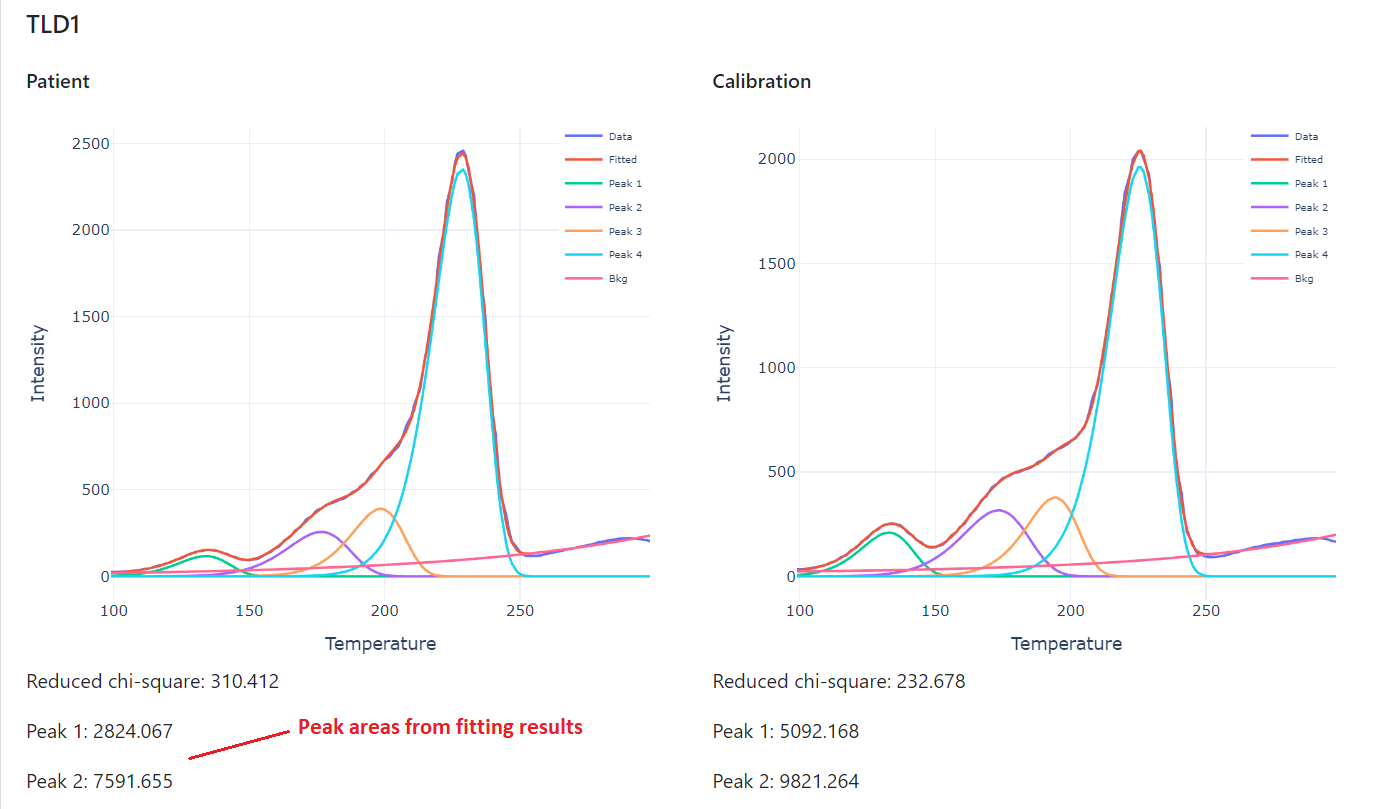
- The fitting results are also shown as below.
How to set inital fitting parameters
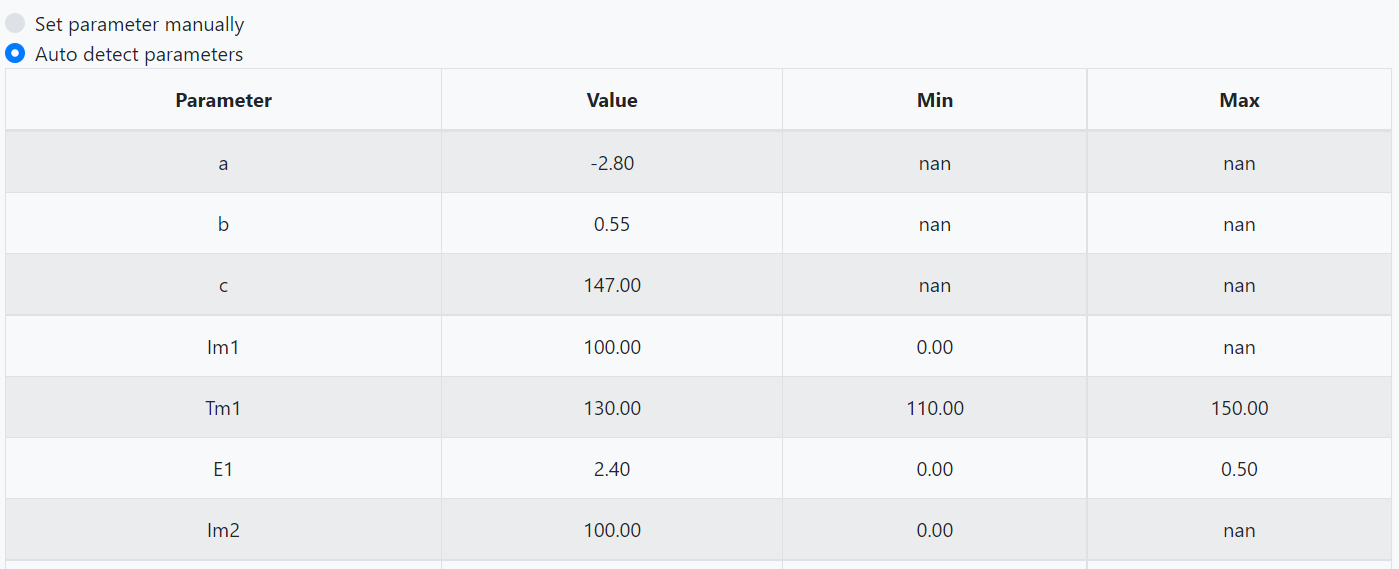
- The program will auto detect initial fitting parameters from glow-curve data. In case you want to do it manually, click on the "Set parameters" button. The default option is "Auto detect parameters", change it by click on the radio button "Set parameters manually" and change the paramaters: (a,b,c) for background, (Im1, Tm1, E1) for Peak 1, etc. accordingly. The 'nan' means no min or max value is set.
- The external parameter file can also be uploaded by using the "Load" button.
- After setting initial parameters, click "Done" button to update.
How to run a demo
- To run a demo using example data, press "Load demo" button and follow the steps to confirm labels and run deconvolution.